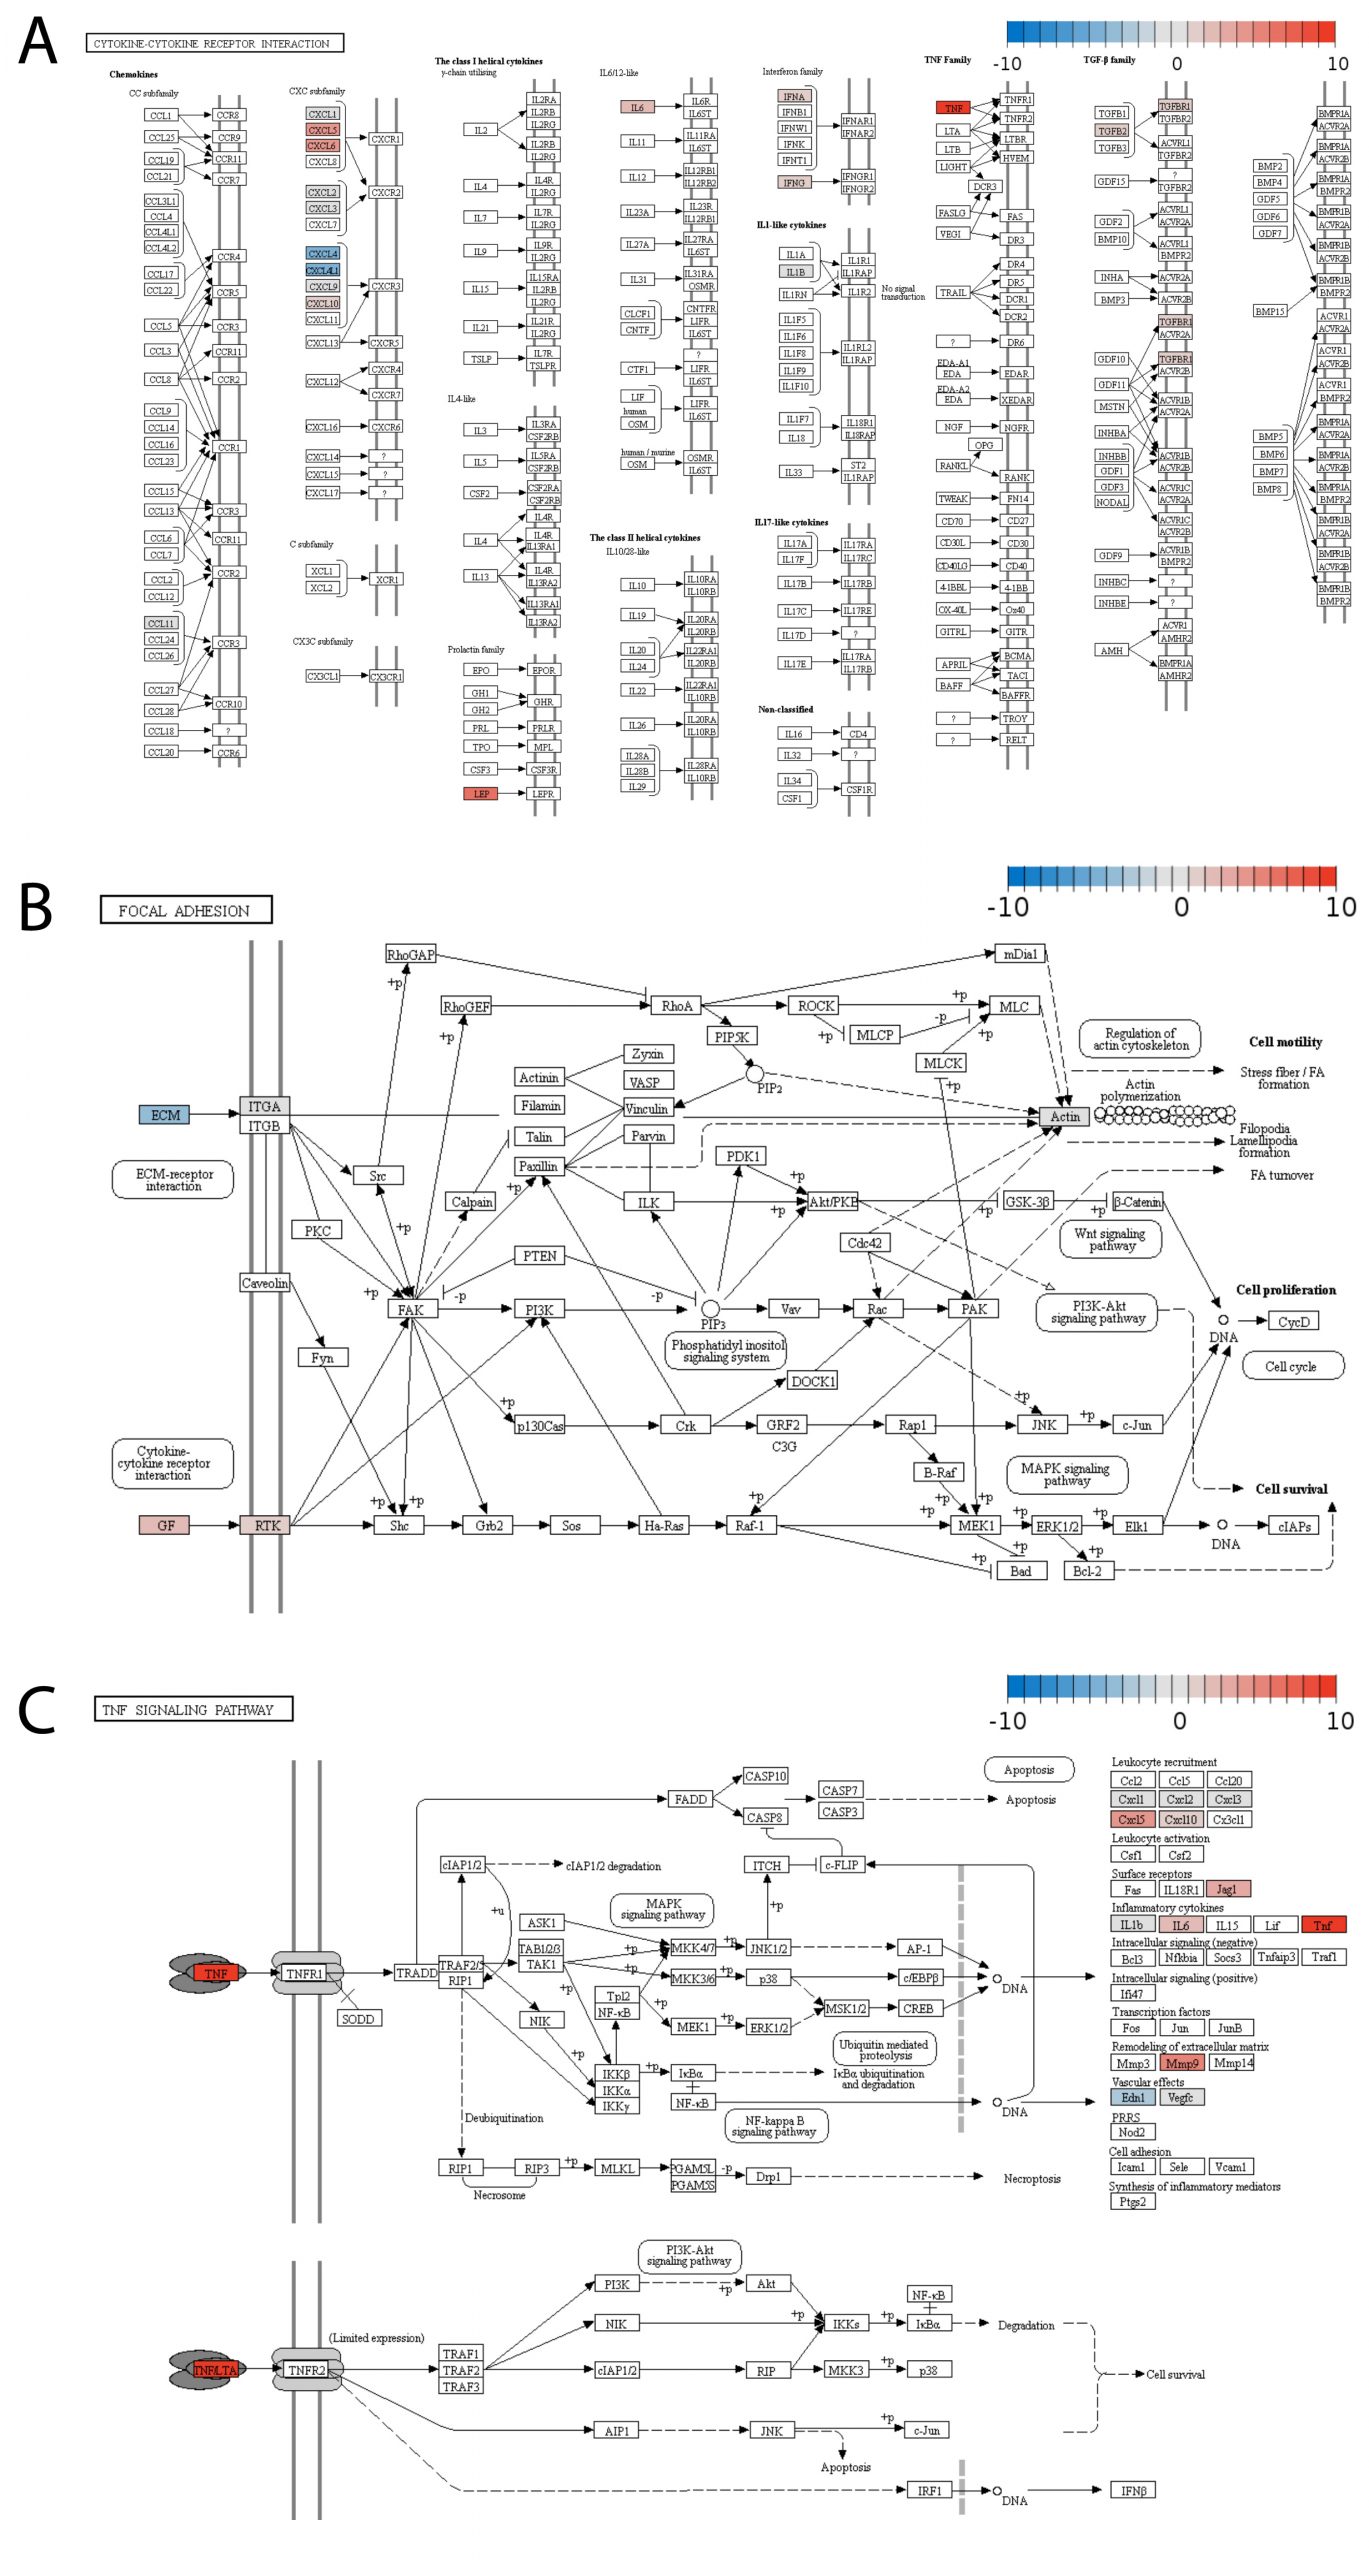
Supplementary Figure 1. The changes in gene expression in human umbilical vein endothelial cells upon Gal-8 treatment in the context of KEGG signaling pathways. The Pathview Web software was used to visualize the pathways with enrichment of the genes that were evaluated as differentially expressed in the PCR assay. (A) Cytokine-cytokine receptor interaction, (B) Focal adhesion, and (C) TNF signaling pathway. The color scale indicates log2-fold changes in gene expression relative to the untreated control.
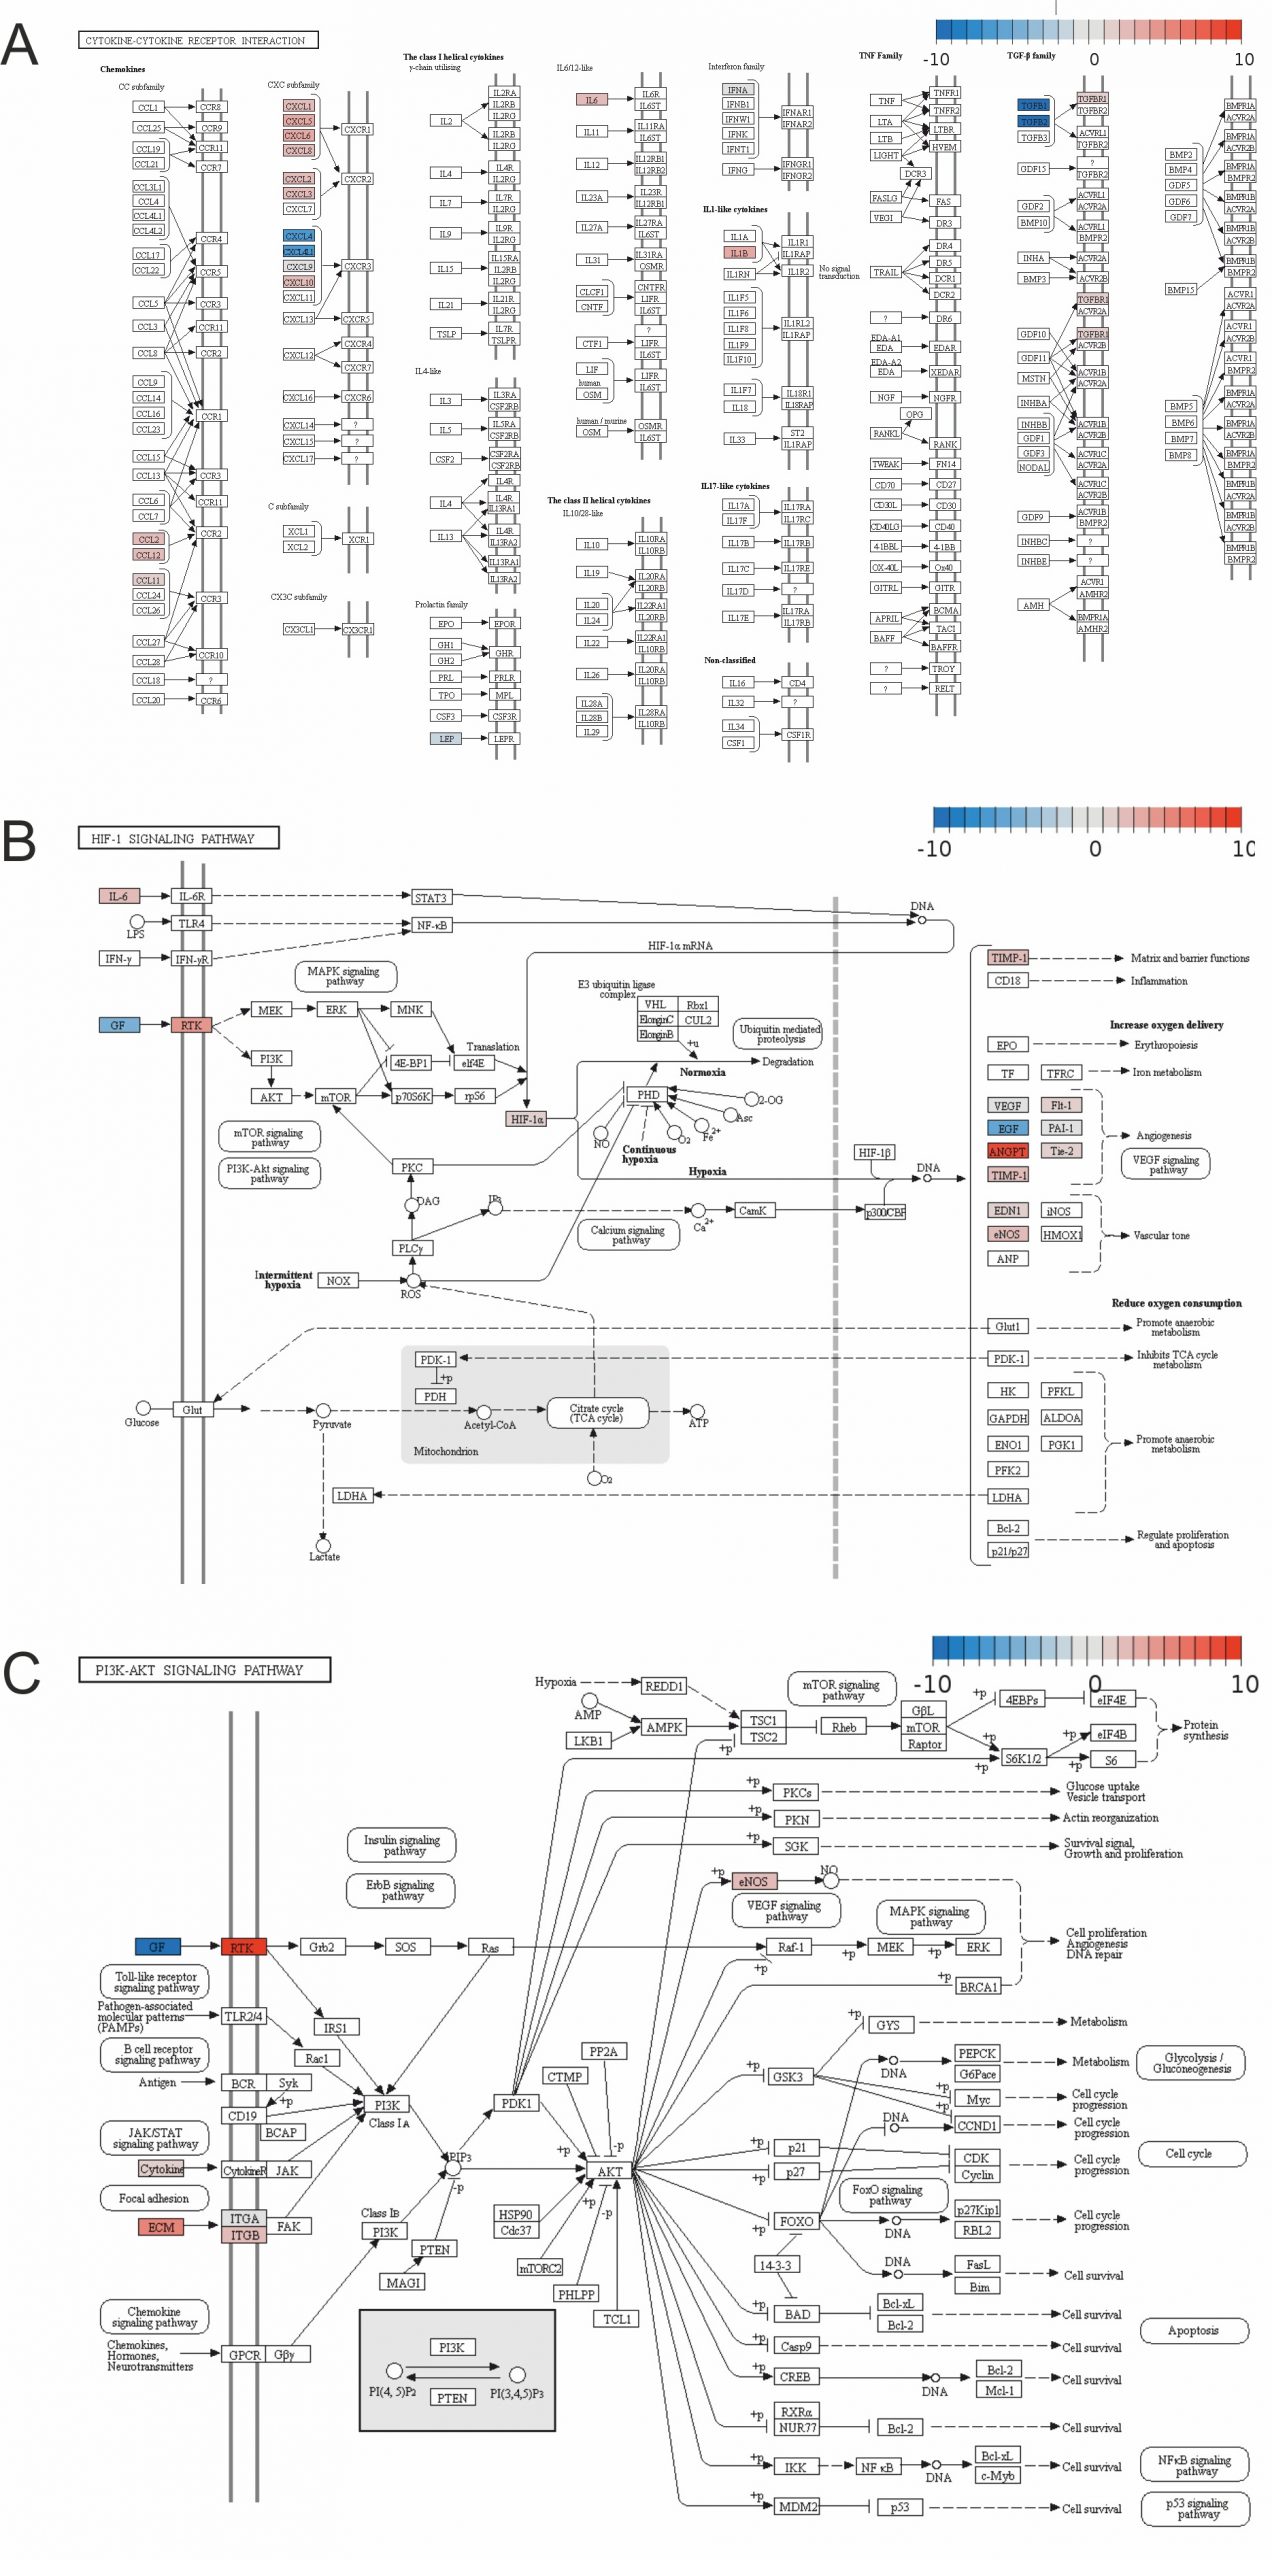
Supplementary Figure 2. The changes in gene expression in human umbilical vein endothelial cells upon combined Gal-8 + VEGF treatment in the context of KEGG signaling pathways. The Pathview Web software was used to visualize the pathways with enrichment of the genes that were evaluated as differentially expressed in the PCR assay. (A) Cytokine-cytokine receptor interaction, (B) HIF-1 signaling pathway, and (C) PI3K-AKT signaling pathway. The color scale indicates log2-fold changes in gene expression relative to the VEGF treated (positive) control.